
BIO340 Laboratory Guide #10
PHYSIOLOGICAL STATES, REFLEXES, AND
RESPONSES IN HUMANS
This is intended to be a fun and informative lab, demonstrating a range of human physiological measures and responses. The lab is set up as a series of "self serve" stations which you can rotate through. Work through these four stations in any order you like. Work rapidly, but feel free to return to any area that is of particular interest to you. These stations will be set up through the weekend, so if you don't make it through all of them, come back and do the rest as soon as you have time.
For many undergraduate physiology courses, the kind of canned demonstration "experiments" set up here would constitute the bulk of the laboratory offerings. Here, they are offered as a sampler of classical human physiology and as a respite from the more demanding labs which you have been doing. Relax, explore, have a good time. Try not to barf during the vestibulo-occulomotor test. Some of these "experiments" may not immediately work well. DON'T PANIC if something doesn't work, just be persistent, ask for help, and let me know what works well and what doesn't. Respectfully submitted for your approval, from the Physiology Zone.
I. CLINICAL CARDIOPULMONARY ASSESSMENT
Heart sounds are produced by valves, which are passively closed by blood pressure differences and function to prevent backflow of blood. The sequence of sounds is usually characterized as "lubb-dupp". The first sound is produced by the mitral and tricuspid valves, which separate the ventricles and the atria and close near the start of ventricular contraction. The second, sharper sound is produced by the aortic and pulmonary semilunar valves, which close at the end of ventricular contraction, when the pressure in each great vessel exceeds the pressure in the corresponding ventricle.
As the left ventricle of the heart contracts, it produces a pressure wave, which travels outward through the systemic arterial system at about 8 m/sec. This produces an arterial pulse, which can be palpated at "pressure points" where an artery passes superficially over a hard deep structure such as a bone. Two standard locations for monitoring the pulse are the radial artery just below the base of the thumb, and the carotid artery just below the angle of the jaw.
You will be using the Korotkov ausculatory method for measuring arterial blood pressure. Blood flow in unrestricted arteries is streamlined and quiet. In fully collapsed arteries blood flow is absent and quiet. In partially occluded arteries blood flow is turbulent and noisy - producing "Korotkov sounds" which can be heard over downstream pressure points, with the aid of a stethoscope. To produce Korotkov sounds and measure systolic and diastolic blood pressure, you will first occlude the radial artery by pumping air into a pressurized cuff around the upper arm. The cuff is, in turn, attached to a aneroid sphygmomanometer, which monitors pressure. As pressure in the cuff is slowly lowered, blood begins to flow in noisy and turbulent spurts at the peak of each systolic pressure wave. As the pressure in the cuff falls, these spurts get longer. At some point the cuff pressure falls below the diastolic low point of the arterial pressure cycle, blood flow becomes streamlined and the Korotkov sounds disappear.
You will be using a conventional "wet spirometer" to measure respiratory volumes. This device consists simply of an inverted chamber within a larger fluid-filled chamber. As the subject breathes into the hose, air displaces water in the inverted chamber, causing it to rise, which in turn moves a pointer along a calibrated scale.
This station takes you through some traditional measures and methodologies of cardiopulmonary assessment. The equipment needed at this station includes a sphygmomanometer (blood pressure cuff), a stethoscope, a watch and a bathroom scale. None of the equipment used in this station has been invented or modified significantly in the last 40 years. You should work in pairs, taking turns serving as patient and "doctor". Do parts A, B, and C in sequence. Do part D whenever the apparatus is free.
A. Heart Sounds
You may be most comfortable listening to your own heart sounds.
1) Start by holding the tambour of the stethoscope against the skin immediately below and slightly to the left of the xiphoid process of the sternum (tip of the breastbone). You should be able to distinguish two distinct sounds with each beat, a muffled "lubb" sound, followed by a sharper "dupp".
2) Try other locations for the stethoscope, to see which provide the clearest sounds. You may be able to hear better if you use the stethoscope with both a bell and a tambour. Be sure to rotate this stethoscope head so that you are listening though the bell rather than the tambour.
Q1: Why is the second "dupp" sound clearer and sharper than the first "lubb" sound (think in terms of the underlying anatomy and mechanics)?
B. Carotid and Radial Pulse
Since your thumb generates a strong pulse of it own, it is best to use your index and middle finger to palpate the radial pulse.
1) To palpate the radial pulse, rest your finger tips lightly across the subject's wrist, just below the base of her thumb.
2) To facilitate feeling the carotid pulse, have the subject bend her neck slightly to the opposite side. Rest your finger tips on her neck, just below and slightly in front of the angle of her jaw (below her ear).
3) Locate either the radial or carotid pulse and count the number of beats in 15 seconds. Multiply this number by 4 to get the heart rate (HR) in beats per minute and record this value.
C. Measuring Blood Pressure by the Ausculatory Method
Don't inflate EITHER THE MANULA OR THE ELECTRONIC blood pressure cuff past 180 mmHg or keep it inflated for more than 60 seconds. Don't put the stethoscope ear pieces into your ears until you have positioned the tambour where you want it.
1) Seat the subject and have her pull one shirt/blouse sleeve up as far as possible. Wrap the blood pressure cuff snugly around this arm, with the smooth side of the cuff towards the skin. Secure the Velcro strips. It is important that the subject's arm be relaxed and at her side, so that the blood pressure cuff is level with her heart. (Why?)
2) Place the stethoscope around your neck and press the flat part of the tambour against the inside of the subject's elbow, below the cuff. Have the subject hold the gauge with her other hand, so that you can see it. Put the stethoscope tubes in your ears.
3) Now tighten the thumbnut on the bulb and pump up the cuff to about 150 mmHg. Loosen the thumbnut slightly and let the cuff pressure out slowly. At somewhere around 130 - 110 mmHg you should begin to hear a "whooshing" sound. The cuff pressure at which you first hear this sound corresponds to the systolic blood pressure (Ps) - the peak of each pulse pressure. As pressure in the cuff continues to drop, this sound will first become louder, then softer and muffled, then fade out (why?) - generally at 90-70 mmHg. The cuff pressure at this point reflects the diastolic blood pressure (Pd)- the low point in each arterial pressure cycle.
4) Record your blood pressure readings as Ps/Pd.
Q2: While the pressure in the cuff is between the systolic and diastolic values, the gauge needle will make a slight up-tick with each heart beat. Why is this?
5) Check your blood pressure and heart rate readings using an electronic blood pressure meter. To use this device simply turn it on, wait for the display to clear, wrap the cuff around the subject's upper arm, and pump the cuff up to ~160 mmHg. As the cuff automatically deflates its electronic pressure sensor will pick up the transient pulse pressure waves and calculate both blood pressure readings and a pulse rate.
6) Using either set of blood pressure and heart rate readings, calculate the pulse pressure (PP) and estimate cardiac stroke volume (SV) and cardiac output (CO) of the heart by the following formulae:
PP = Ps - Pd PP in mmHg
CO = k x HR x PP where k = 1.7 mL mmHg/beat CO in mL/min
SV = CO/HR SV in mL/beat
7) Now measure the blood pressure while the subject is holding her right arm over her head. Take several measurements, recording the blood pressure and the height of the cuff relative to the heart for each set.
8) If you have time, try taking a reading with the cuff around the right thigh and the stethoscope tambour held behind the knee, and/or with the cuff around the right calf, with the stethoscope tambour held just below the medial malleolus (inner ankle bone).
9) Take a look at (and try out) the classic mercury sphygmomanometer. This device illustrates why blood pressure is measured in units of millimeters of mercury (mmHg).
D. Respiratory Volumes
1) Zero the spirometer by positioning the pointer and the slide together at the zero mark. Put a fresh mouthpiece in the spirometer hose. Sit down, get comfortable and breathe in a normal rhythm for at least 30 seconds.
2) Count the number of breaths you take in the next 30 seconds and multiply by 2 to determine your resting respiration rate (RR).
3) After a normal, resting inspiration, place the mouthpiece between your lips and breath out in normal unforced manner. Record where the pointer stops, then slide the pointer back to the zero mark. Repeat this process twice more and average the three readings, this is the tidal volume (TV).
4) Resume unforced, resting breathing for at least 30 seconds. After a normal expiration, place the mouthpiece between your lips and forcibly exhale all the air possible. Record where the pointer stops, then slide the pointer back to the zero mark. Repeat this process twice more and average the three readings, this is the expiratory reserve volume (ERV).
5) Resume unforced, resting breathing for at least 30 seconds. After a normal expiration, breathe in as deeply as possible, place the mouthpiece between your lips and forcibly exhale all the air possible. Record where the pointer stops, then slide the pointer back to the zero mark. Repeat this process twice more and average the three readings, this is the vital capacity (VC).
6) Calculate the following additional respiratory volumes:
inspiratory reserve volume (IRV) = VC - (TV + ERV) IRV
inspiratory capacity (IC) = TV + IRV = VC - ERV IC
expiratory capacity (EC) = TV + ERV = VC - IRV C
minute volume (MV) = TV x RR x 1 minute MV
7) Weigh the yourself on the scale. Use your weight, and breath rate to determine a predicted basal tidal volume, using the graph on the table.
Q3: How do your predicted and actual tidal volumes compare?
Q4: What other information would you need to calculate the respiratory dead space?
II. ELECTROPHYSIOLOGICAL INDICES:
RESTING PROPERTIES AND RESPONSES TO STRESS AND EXERCISE
The MacLab system offers multiple advantages over the conventional, time-honored methods of physiological assessment. The first is that it allows fairly precise quantification of temporal properties of physiological states and responses. For the heart beat, which is a repetitive cyclic process, the relevant temporal properties include the latency between separate events in the cardiac cycle, or between the heart beat and the arrival of the consequent pulse pressure wave at a distant arterial site. The MacLab also allows real-time derivations to be applied to the data, for example, calculating relative respiratory volume from the measured respiratory flow rate. Finally, the MacLab allows not only assessment of resting or baseline values, but also a detailed record of physiological responses to stimuli and stressors. You will be looking at the "startle" response to an unexpected event, as well as more prolonged responses to a rather different type of sustained stressor - exercise.
In order to record an electrocardiogram (ECG or EKG), all you really need to do is position a pair of electrodes on either side of the heart. By convention, electrodes are usually placed at three locations, equivalent to the corners of "Einthovens triangle" . This is an equilateral triangle, which is oriented on the chest, apex down. Due to some esoteric aspects of "volume conduction", you can get away with attaching the three electrodes to both wrists and one leg.
Galvanic skin resistance (GSR) measures the electrical resistivity of the skin to a small applied current, and is the major index monitored as a "lie-detector" in a standard polygraph test. The GSR is a sensitive psychophysiological index, in that skin resistance decreases fairly abruptly and reliably during periods of emotional stress, anxiety, "nervousness", etc. It will also drop if the subject is startled, or experiences a painful stimulus.
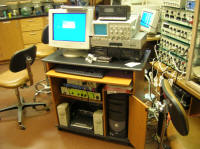
The equipment needed at this station includes a PowerLab/PC station, 1 BioAmp, 3 EKG electrodes and leads, 1 spirometer, 1 pneumoplethysmograph, 1 heart microphone, 2 GSR electrodes and leads, 1 GSR bridge amplifier, 1 "cricket" frog, and 1 live duck.
Choose a subject who appears to be in good physical shape and has no known cardiopulmonary or cardiovascular anomalies or arrhythmias.
A. Resting Respiration, Heart Rate, Heart Sounds and Pulse Volume
1) If a duck has not been provided for you, go out to Foster lake and catch one. Or not. The following transducers should be connected to the MacLab box (if they aren't, then connect them):
CH1 - BioAmp (with cable and 3 EKG leads)
CH2 - finger pulse transducer (connected through Ch 1 of the ETH-400)
CH3 - Heart Microphone
CH4 - spirometer amplifier (with spirometer sensor and tubing attached).
2) Hookup the subject to the PowerLab, using the following guide:
a) Snap new electrodes onto the three EKG leads (red, white, and black).
b) Stick the WHITE electrode to the subject's RIGHT WRIST.
Stick the BLACK electrode to the subject's LEFT WRIST.
Stick the RED or GREEN electrode to the subject's LEFT ANKLE.
c) Attach the clip on the EKG gray cable somewhere convenient on the subject's clothing.
d) Fasten the PULSE TRANSDUCER (pneumoplethysmograph) onto the MIDDLE FINGER of either hand, using the small Velcro band. The flat transparent surface should be pressed snugly against the fleshy part of the end of the finger.
e) Put a small dab of electrode paste onto each of the GSR electrodes, then tape the electrode pair to the palmar surface of the ring finger of either hand.
f) Position the HEART MICROPHONE over the fifth rib and slightly to the left of the sternum. Secure it in place with the elastic/velcro band.
g) Wipe the RESPIROMETER MOUTHPIECE with an alcohol swab, then wipe it dry. Solicit any final comments from the subject, then put the BLUE end of mouthpiece in the subject's mouth.
h) Have the subject get comfortable, put her hands lightly on her knees, and relax.
3) Turn on the PowerLab box and the PC. Make sure that the DC transformer line is plugged into Eth-400 bridge.
4) Select ML Human Phys I on the desktop and launch it. All of the channels have been set up and labeled for you. Notice that Channel 5 is labeled as Resp. Vol. and is set up as a computed function of channel 4, which is labeled as Resp. Flow. Notice also that Channel 6 is labeled as Heart Rate and is computed from Channel 1.
Q5: What is the mathematical relationship between display channel 5 and display channel 4? You can look in the Computed Input... menu of channel 5 to find this information.
5) Start the Chart display. Adjust the display ranges and any other Chart parameters to produce effective displays of all six physiological indices. If necessary adjust the threshold for Channel 6, so that it is producing an accurate readout of the heart rate. Make sure that inspiration is up, and that the P, R, & T peaks of the EKG are up.
6) Once you have good settings, run the display for at least a minute, to get a good baseline display.
"Normal" resting baseline values for the duration and voltage of different phases of the EKG complex are:
P wave: 0.1 sec duration P-R interval: 0.13 to 0.16 sec
0.2 mV amplitude Q-T interval: 0.30 to 0.34 sec
QRS complex: 0.08 to 0.12 sec duration P-R segment: 0.03 to 0.06 sec
1.0 mV amplitude S-T segment: 0.08 sec
T wave: 0.16 to 0.27 sec duration
0.2 to 0.3 mV amplitude
Q6: Identify the EKG peaks (P, QRS, T) associated with each cardiac cycle. How closely do the resting values of your subject's EKG peaks correspond to the "textbook" examples listed above?
Q7: What accounts for the latency (time lag) between the "R" peak of the EKG and positive peak of the finger pulse volume? Using this lag and an estimate of the heart-to-finger distance, calculate the mean pulse velocity through the brachial arterial system.
Q8: Identify the peaks in the heart sounds trace which correspond to "lubb" and "dupp" sounds. You may need to listen to the heart sounds via a stethoscope, while watching the heart sounds trace on the screen. What is the temporal relationship between the heart sounds and the EKG peaks? Does the relationship which you observe make functional sense in terms of the cardiac cycle?
B. Calculating the "Heart Axis"
The "heart axis" corresponds to the orientation (base-to-apex) of the heart within the chest and the strength of the overall electrical vector of ventricular depolarization. It is usually expressed as an orientation (in �) and a strength (in mV), and may be obtained by fairly simple vector addition of QRS peak values for each of three recording electrode configurations. To accomplish this calculation you will need to obtain stable, baseline recordings of the EKG from the subject for each of three electrode configurations, generally referred to as "LEADS" (see handout).
1) Make an ~30 second resting recording with each of the following electrode configurations:
LEAD I - (left arm relative to right arm)
WHITE electrode to RIGHT WRIST
BLACK electrode LEFT WRIST
RED or GREEN electrode to LEFT ANKLE
LEAD II - (left leg relative to right arm)
WHITE electrode to RIGHT WRIST
BLACK electrode LEFT ANKLE
RED or GREEN electrode to LEFT WRIST
LEAD III - (left leg relative to left arm)
WHITE electrode to LEFT WRIST
BLACK electrode LEFT ANKLE
RED or GREEN electrode to RIGHT WRIST
2) When you are finished, return to the LEAD I configuration.
3) You will be given a handout describing how to measure the electrical axis of the heart.
4) AFTER THE LAB IS OVER, use the MacLab cursors and the instructions in the handout to measure the height of the QRS complex of the EKG for each of the three leads, and record these values below:
LEAD I amplitude
LEAD II amplitude
LEAD III amplitude
5) The handout demonstrates how to use these three "LEAD" values to graphically determine the electrical axis of the heart, and provides a blank for doing this. AFTER THE LAB IS OVER, use this method to graphically determine the heart axis for your subject. help.
a) Produce printouts of ~5-10 second sections of resting EKG recordings for leads I, II, and III.
b) Produce a graph (as in section B of the heart axis handout) illustrating how you obtained theelectrical axis of the heart. Write the value you obtained (in � and mV) on the graph.
C. Startle Response
Some physiological indices show transient responses to unexpected transient stimuli. The most reliable of these indices is the ganvalnic skin resistance (GSR), but you may be able to record transient heart rate, pulse volume, and respiratory responses as well.
1) Uncouple the heart microphone from the PowerLab Channel 3 and replace it with the GSR bridge amplifier output cable. Remove the heart microphone from the subject.
2) Turn on the GSR bridge amplifier. Close ML Human Phys I (after saving your data) and open ML Human Phys II.
3) Have the subject relax, then start the Chart recording. Adjust the baseline and sensitivities on each of the Chart traces, as necessary, then make a 30 second baseline recording.
4) Try each of the following manipulations (#5-#7). For each one, keep careful notes of what the stimulus was, and exactly when in the record it occurred, so that you can insert notes into the completed record to mark and annotate stimulus events. With each of these manipulations, observe which of the physiological indices responded and the nature (direction, amplitude, latency, duration) of the response.
5) Pinch the subject's arm. You should get a prominent GSR response (if not, try increasing the sensitivity of the GSR recording).
Q9: Does it matter which arm you pinch?
6) Create a sudden noise behind the subject (by snapping your fingers loudly, clicking the cricket frog, dropping a book, or dropping the duck).
Q10: In which indices did you get responses?
3) Try a series of 3-4 simple factual questions with yes/no answers (e.g. are you 20 years old?, are you a female?). Brief the subject on the questions, so that she knows what the correct answers are without having to think too hard. Now repeat each question twice and instruct the subject to tell the truth once and lie once for each question.
Q11: By looking at the Chart traces can you distinguish truthful answers from lies? If so, which physiological indices (if any) are most useful as a "lie detector"?
D. Response to Exercise
You should reasonably expect heart rate, pulse volume, and respiratory rate to increase with exercise, and you will conduct a brief test of that here. Unfortunately, movement on the part of the subject will generate some "movement artifacts" in the electrophysiological recordings, so watch out for these.
1) Seat the subject on the exercise bike and have her rest her hands lightly on her hips and her feet on the pedals.
2) Start Chart and record continuously. Make a careful note of the starting and ending times on the Chart record for each of the following periods (so that you can mark and annotate the record when you are through):
a) Have the subject rest for at least two (2) minutes.
b) Have the subject exercise at a moderate level on the bike for at least five (5) minutes.
c) Have the subject rest for at least five (5) minutes.
3) Stop Chart and internally label the record when you are through.
Q12: As the heart rate speeds up during exercise, the length of ventricular systole (Q-T interval) should increase relative to the length of ventricular diastole (T-next Q interval). Did the ratio of systole/diastole, in fact, increase during exercise for your subject?
Q13: Did the heart-to-finger pulse latency decrease during exercise? Should you have expected it to, and why?
III. NEUROLOGICAL SIGNS AND REFLEXES
The pupillary reflex adjusts the size of the aperture in the iris to ambient light levels. The light sensors involved in this reflex are the photoreceptors of the retina. In addition to the primary visual retinal projection to the lateral geniculate nuclei of the thalamus, each optic nerve also projects to the superior colliculi and pretectal regions of the midbrain. The motor side of the reflex involves projections from each pretectal nucleus to both midbrain occulomotor (NIII) nuclei. A specialized region (the Edinger-Westphal nucleus) of each occulomotor nucleus, in turn, projects ipsilaterally to the pupillary sphincter muscle fibers. The partial crossovers within the midbrain result in both direct (ipsilateral) and consensual (contralateral) pupillary responses to a unilateral light flash delivered anywhere on either retina.
During visual fixation, the occulomotor nuclei function to rotate the eyes in such a way as to keep images relatively stationary on the retina. This reflex involves fairly slow processing, coupled with a rapid motor response - the saccade. Saccades also function in repetitive eye movements to quickly establish new fixation points. For example, you execute a saccade at the end of each line of type, in fact, if I can stretch this sentence out, you will execute one right ---now. In order for the eyes to maintain fixation while the head is rapidly turned, the occulomotor system must also be strongly driven by the vestibular system. The vestibular nuclei monitor motion of the head by monitoring inertial motion of fluid in the semicircular canals, and drive the eyes, via the occulomotor nuclei, in a direction opposite the apparent head motion. These two reflex systems can be made to "disagree" by inducing artificial inertial motion in the semicircular canal fluid. A simple way to do this is to spin the subject, then abruptly stop the spin.
The Babinski response (dorsiflexion of the foot in response to stroking the sole), is ordinarily inhibited by tonic activity in the descending corticospinal tract. A positive Babinski sign in adults is therefore indicative of corticospinal damage.
Stretch receptors in the patellar tendon monitor tension in the quadricep muscles of the anterior thigh. When the patellar tendon lengthens slightly, these receptors operate through a disynaptic reflex arc in the spinal cord to increase quadricep tension. This is a fast "postural" reflex which functions, in concert with the monosynaptic "gamma" muscle spindle reflex, to maintain fairly constant background tension in the quadriceps. If the patellar tendon is artificially stretched, the reflex functions to induce a sudden contraction of the quadriceps and subsequent extension of the leg.
The equipment needed at this station includes a penlight, a swivel chair, a toothpick, a reflex hammer and a raw egg. Work in pairs and take turns being the subject and the experimenter.
A. Direct and Consensual Photopupillary Reflexes
1) Seat the subject in a darkened (but not completely dark!) room and sit opposite her where you can clearly see her pupils. Allow at least 2 minutes for her eyes to adapt to the dark and for her pupils to dilate. Hold the penlight about 6 inches from the bridge of her nose and flash the light for about 1/2 second.
Q14: Did both pupils constrict? Did they constrict evenly?
2) Now have the subject hold a piece of dark construction paper up as a shield between her two eyes. The subject should continue to look straight ahead. Hold the penlight off to the subject's right side and flash it again, so that only her right eye is illuminated.
Q15: Did both pupils constrict? Did they constrict evenly? What can you conclude about the relative magnitudes of the direct (illuminated right eye) and consensual (non-illuminated left eye) pupillary reflexes?
B. Vestibulo-occulomotor Reflex
Don't participate in this experiment as a subject if you get motion sickness.
1) Have the subject sit in the swivel chair, tilt her head slightly forward (why?), grasp the bottom of the chair, close her eyes, and hang on. Spin the chair clockwise through at least ten full rotations.
2) Stop the chair and have the subject immediately open her eyes, hold her head up, and fixate (look directly at) a point behind your (the experimenter's) shoulder. Closely observe the motion of her eyes. Her eyes should go through a series of jerky tandem motions as they both drift slowly in one direction and then saccade rapidly back in the opposite direction.
Q16: Do the drifts or saccades match the direction of the original spin? What is the subject's visual perception, i.e. what direction does the world seem to be moving to the subject?
Q17: Why does this process promote disorientation, vertigo, and nausea?
Q18: Can you explain the neural mechanics of this reflex?
3) If you are having trouble understanding what is going on inside of the semicircular canals, try the following experiment. Spin the raw egg on the table. Stop the egg with your hand, then immediately let go. The egg should "magically" start spinning again, due to the inertia of the fluid contents.
C. Babinski Sign
1) Have the subject sit down, remove her shoe and sock on one foot, and cross that leg over the other one.
2) Using the toothpick, and light pressure, stroke the lateral (little toe) side of the sole of her foot from toe to heel or from heel to toe.
Q19: Did her toes plantar flex (towards the sole) or fan out and dorsiflex (towards the top of the foot)? What would a dorsiflexion indicate?
D. Patellar Reflex
1) Have the subject sit down and cross one knee over the other so that the crossed leg is hanging relatively free.
2) Using the rubber hammer, lightly tap the crossed leg just below the kneecap. If you do this correctly, the tapped leg should jerk forward.
Q20: Can you describe the neural mechanism underlying this reflex and why it is essential for standing postural balance?
IV. NEUROPHYSIOLOGY
Regions of the brain that are coherently organized and tend to be coherently activated generate coherent electrical fields which can be monitored as slow coherent electrophysiological activity, or "brain waves", in the electroencephalogram (EEG). Sound coherent? Actually, it isn't. Making physiological sense out of the EEG, requires that you understand how the EEG is neurologically generated, how electrical fields are conducted within the skull, and what the valid methods of inference from EEG phenomena to physiological conclusions are. Since probably less that 1% of the researchers who conduct EEG research actually understand either the physical or physiological basics of what they are recording, it is a safe estimate that more than 99% of published EEG "findings" are complete and utter nonsense. In addition, the apparent simplicity of EEG recording has fostered a rather large industry of dubious (quack?) psychological and medical practices and devices, such as "alpha conditioning" machines. This has tended to give the EEG an undeservedly bad reputation as an "old-fashioned" and suspect measure of neuronal activity, and is a main reason why any word with the phoneme "psy" in it sends a slight shiver down the neck of many neuroelectrophysiologists. On the other hand, if you want a real-time picture of the activity of large neural ensembles in the brain, EEG is still the only game in town (although superconducting quantum interference devices (SQUID) and magnetoencephalograms (MEG) have recently made some inroads).
EEG recorded from the scalp reflects activity arising predominantly from the cerebral cortex, and specifically from the gyri of the cortex. This activity is generated almost exclusively by the principal cortical neurons, the pyramidal cells, which are oriented perpendicular to the surface of the skull. At a first approximation, this activity represents the summed extracellular currents in the pyramidal cells' dendritic arbors. The EEG itself, is therefore most useful for studying cortical activity, cortical processes, and cortical disorders. The EEG exhibits several phenomena which are clinically useful, for such limited applications as characterizing sleep/wakefulness stages, localizing brain tumors, and localizing epileptic foci.
You will be looking at some factors surrounding the production of "occipital alpha" activity. The normal EEG of a resting alert person has activity predominantly in the "beta" frequency band (~13-30Hz). This is irregular, non-coherent, low amplitude, high frequency activity, which can be recorded over virtually any part of the cerebral cortex. If the person is sufficiently relaxed, when she closes her eyes, the activity in some regions of the cortex will rapidly revert to "alpha waves". Theses are coherent, high amplitude, sinusoidal oscillations at a single dominant frequency of ~8-13 Hz, which are strongest and most coherently organized over the occipital cortex. Occipital alpha will disappear as soon as the subject opens her eyes. Alpha will also be diminished if she is startled, if she is disturbed, or if she engages in some rigorous mental task. This later phenomenon is termed "alpha suppression" or "alpha blocking".
For this experiment to work well you will need a fairly relaxed and mellow subject who does not grind her teeth. (Teeth-grinders produce too much muscle artifact activity and make annoying roommates. �Hyper" people also tend not to have very good alpha activity. The instructor takes some false pride in the fact that he has very low artifact levels and good alpha. Find him and wake him up if you have any questions.)
The equipment needed at this station includes a PowerLab/PC station, a Dual BioAmp, 1 ElectroCap, and 2 shielded reference leads with ear clips.
A. Resting EEG
1) The following transducers should be connected to the PowerLab box (if they aren't, then connect them):
CH1 - BioAmp A (with cable and 3 EEG leads)
CH2 - BioAmp B (with cable and 3 EEG leads)
2) Hookup the subject to the PowerLab, using the following guide (color codes refer to the colored markings on the gray BioAmp cable):
3) Prepare each ear lobe by cleaning it thoroughly with an alcohol swab, then rubbing it with some "Omni" solution, as demonstrated by the instructor. Clip the BLUE A1 earclip electrode to the LEFT earlobe and the WHITE A2 earclip electrode to the RIGHT earlobe. The metal cup of each electrode goes on the outer surface of the earlobe. Use the blunt syringe to fill the cup of each electrode with electro-gel. Secure each electrode with paper tape.
4) Attach the rainbow-colored elastic chest band around the upper chest of your subject with the snaps in the front.
5) Slip foam "doughnut" pads to each of the two front polar (FP1 and FP2) electrodes on the ElectroCap. The sticky side of the electrode goes toward the cap.
6) Position the ElectroCap on the head of the subject. Make sure that the cap is centered on the head, with the foam pads at the front. The two foam pads should rest ~1" above the subject's eyebrows.
7) Snap the two staps to the chest band, crossing them over in the front.
8) Find the electrodes labeled O1, O2, T3, T4, and GND. O1 and O2 will be over the occipital lobes about 1" above and to either side of the "inion"(the depression at the base of the occipital bone on the back of the head). T3 and T4 will be above the temporal lobes about 1 inch directly above the left and right ear, respectively. GND will be over the center of the head, just in back of where the cables come out of the cap.
9) Apply some Omni to the wooden end of a sterile swab, stick it through the hole in the O1 electrode and gently abrade the scalp. What you are trying to do is get rid of most of the dead skin cells, and a bit of the epidermis. Try to almost, but not quite, draw blood. Repeat this process for the O2, T3, T4, and GND electrodes. Fill all five of these electrodes with ElectroGel, using the blunt syringe. This may sting a bit for the subject.
10) Have the subject get comfortable, put her hands lightly on her knees, and RELAX.
11) Turn on the PowerLab box and the PCh. Select the ML Human EEG alias on the desktop and launch it. The two channels have been set up and labeled for you. Notice that Channel 1 is labeled as Occipital and channel 2 is labeled as Temporal. Notice also that the display settings involve some fancy PowerLabisms, such as filters on each channel, a compression of the horizontal scale, and a "smoothing" of each trace. These are necessary to enhance the EEG display.
12) Start the Chart display. Have the subject relax, with her eyes open. It is particularly important for a "clean" recording that the subject not clench her teeth (why?). The resting "beta" EEG should show high-frequency, low amplitude activity on both channels. If it does not, consult with the instructor.
13) Record at least 1 minute of resting EEG activity.
Q21: Is the resting activity for the two channels synchronized?
Q22: Does the resting activity for the two channels look qualitatively similar? Does it have similar overall amplitude and frequency properties?
B. Occipital Alpha and Alpha Blocking
For the following recording, you will need to keep accurate records of exactly when the subject opened her eyes, closed her eyes, etc. so that you can mark and annotate the Chart record.
1) Have the subject relax with her eyes open.
2) Start the Chart display. and record at least 1 minute of resting beta activity.
3) Now instruct the subject to "clear her mind", allow herself to become deeply relaxed, and lightly close her eyes. If you are lucky, one or both channels will shift into higher amplitude, lower frequency (8-12 Hz) sinusoidal oscillations - alpha activity.
4) Record at least 1 minute of this activity. If you are not getting any alpha activity, it is most likely because the subject is not fully relaxed, or because the scalp preparation was inadequate. In either case, try a few more times before consulting with the instructor.
5) If you are getting good alpha, have the subject open her eyes and close her eyes several times, with at least 10 seconds between each action, and observe the record for alpha activity.
6) Finally have the subject relax with her eyes closed, and establish clear alpha activity. Snap your fingers behind her head and observe the recording. Does the click block or suppress alpha activity. Snap your fingers several more timeS.
Q23: Does the alpha suppression response "habituate" or diminish with repeated stimulations?
Q24: Which recording site (occipital or temporal) shows stronger alpha? Since alpha seems to be most directly blocked by visual input, does this agree with what you know about the site of primary cortical processing of visual information?
C. Cleanup
1) When you are satified with your recordings, save the data files.
2) Carefully remove the ElectroCap, chest strap, and earclip electrodes. Clean as much electro-gel as possible from the subject's hair, using gauze pads.
3) Rinse off the earclip electrodes in water, then swab with an alcohol swab.
4) Immerse the ElectroCap in a sink filled with dilute dish soap.
V. PREPARATION OF THE LAB DATA SHEET
Your data sheet should include all FIVE of the items described in the boxes above. Make sure that the axes of all of the graphs and print-outs are labeled and calibrated. You should certainly discuss your results and the answers to the questions with your partners and others in the lab. However, please work independently when you prepare your data sheet.